Painting the Growing Season in the Maize Triangle
Radar data from an agricultural area in South Africa, shown in a vivid color palette, reveal crop types and how they changed during the Southern Hemisphere’s growing season.
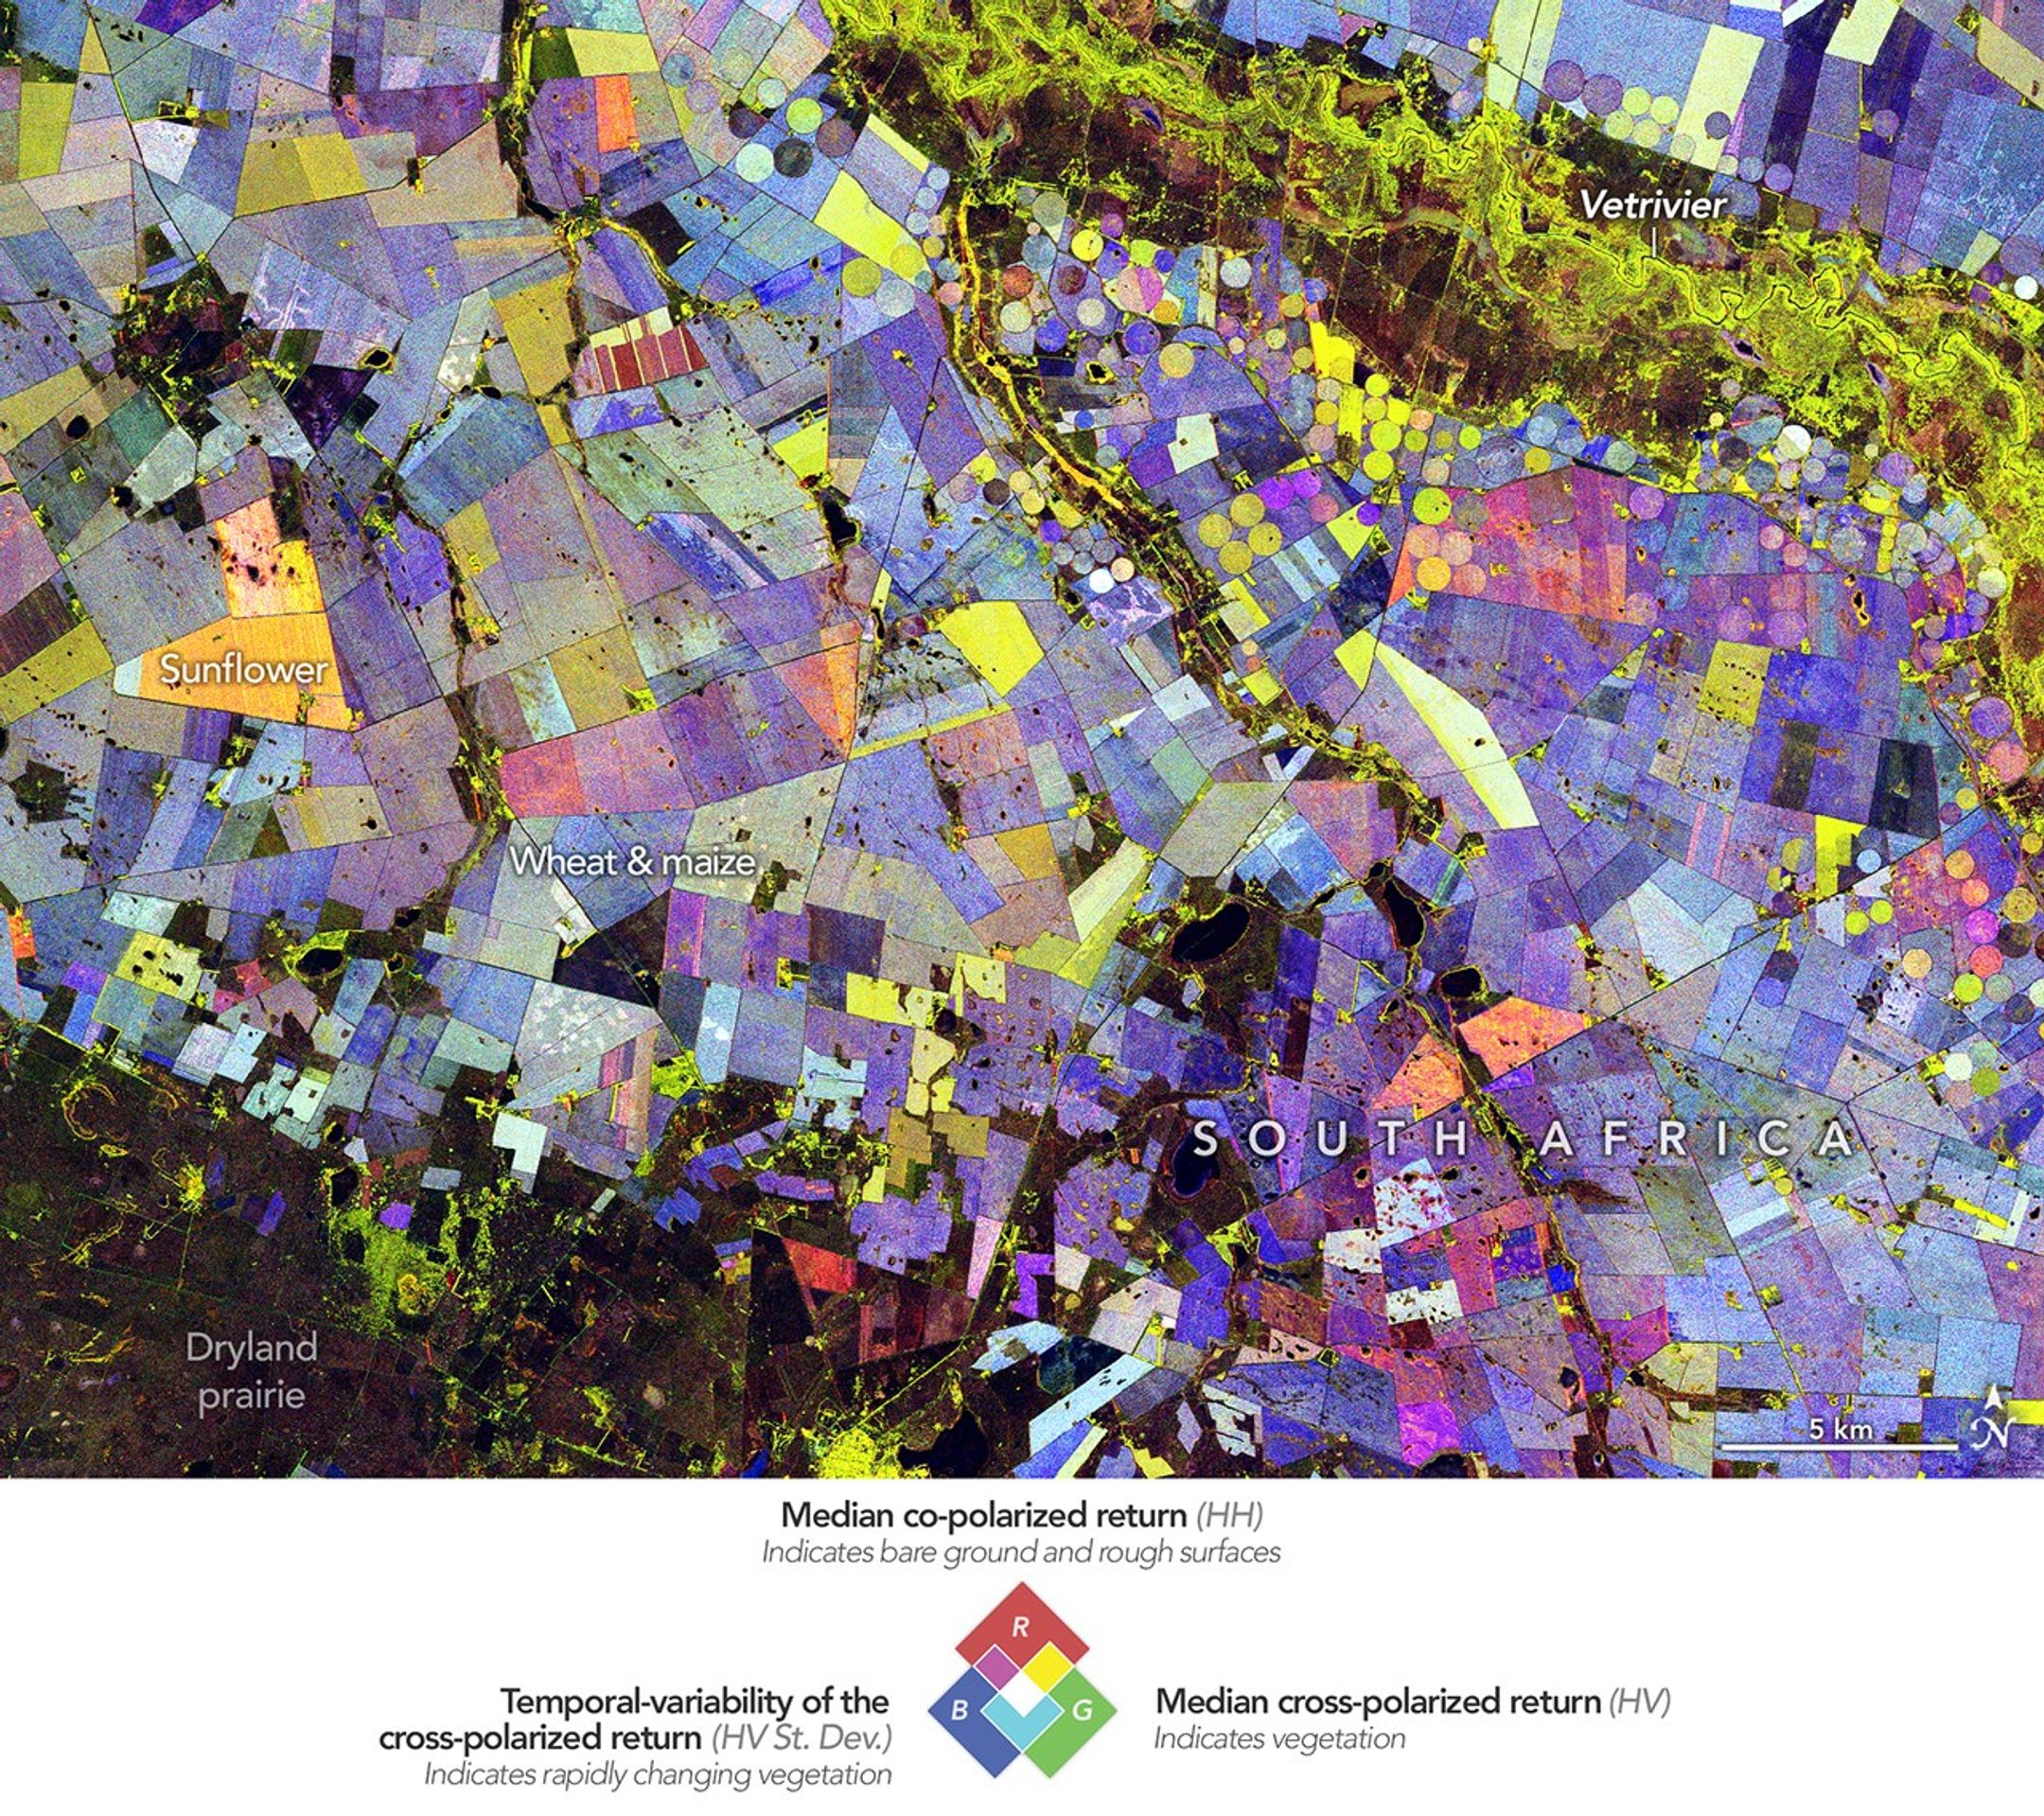
Radar data from an agricultural area in South Africa, shown in a vivid color palette, reveal crop types and how they changed during the Southern Hemis
Read Full Story at NASA →Why This Matters
Satellite and radar imagery isn’t just for weather forecasts—it’s becoming a vital tool for tracking global food security in real time. By visualizing crop cycles with high-resolution data, researchers and policymakers can anticipate supply shortages, price volatility, and even the spread of agricultural diseases before they disrupt markets.
Background Context
The "Maize Triangle" in South Africa isn’t just a geographic quirk; it’s the backbone of the country’s staple food economy, producing over 60% of its maize. Decades of industrial agriculture, climate variability, and land reform debates have shaped its current farming landscape, making it a microcosm of broader challenges in African food systems.
What Happens Next
As climate patterns grow less predictable, the ability to monitor planting and harvest cycles in near-real time could redefine risk management for farmers and insurers alike. Investors may pivot toward regions with more transparent agricultural data, while governments could face pressure to integrate these tools into national food security strategies.
Bigger Picture
This shift toward data-driven agriculture reflects a global trend where precision monitoring tools are narrowing the gap between field-level realities and macroeconomic forecasts. If scalable, such systems could help mitigate the "silent crises" of food insecurity that often unfold unseen until they hit vulnerable populations.